The phrase is used loosely, the underlying behaviour is real, and the evidence is
better than the headlines suggest. This page sets out what the term means clinically, when the
mechanism was built, how many people meet the criteria, and what the measured effects are, with
the study behind every number.
Written by the developer of Handover, an iOS app built for this problem.
Sources listed in full at the end. Last revised August 2026.
01
What screen addiction means, and what it does not
No diagnostic manual contains it. The DSM-5 has no entry for smartphone addiction, and
the ICD-11 recognises gaming disorder but not phone use in general. What exists instead is a
research literature built on self-report scales, the most widely used being the Smartphone
Addiction Scale, Short Version, a ten item instrument published by Kwon and colleagues in
2013 and since translated into dozens of languages.
Those scales do not measure hours. They measure the features that make any behaviour
compulsive: using the phone longer than intended, failing at attempts to cut down, checking
it first thing and last thing, feeling restless when it is not to hand, and continuing in
situations where the use is clearly costing something. A person on the phone for four hours
of deliberate work scores low. A person who checks it ninety times without deciding to once
scores high.
This distinction matters for the whole argument. Screen time is a measure of quantity and
it is a poor predictor of harm. Loss of control is a measure of quality, and it is the part
that predicts the outcomes further down this page.
The instrument
SAS-SV, ten items, six point agreement scale. A score above the cut-off is described in the
literature as problematic use, not as a diagnosis. No blood test, no scan, no clinical
threshold agreed across countries.
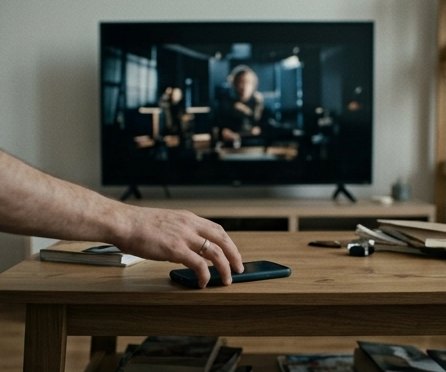
FIGURE 1. The first reach of the day, made before the day has been decided on. Problem use is defined by pickups like this one, not by total hours.
02
When it started, and what was built in each step
The behaviour is recent enough to date precisely. Its ingredients were added one at a
time, each for a defensible commercial reason, and none of them was designed as an
addiction mechanism. The result was assembled in roughly a decade.
The underlying schedule is much older. Variable ratio reinforcement, in which a reward
arrives after an unpredictable number of actions, was described by B. F. Skinner in the
1950s and is the most persistent reinforcement schedule known in behavioural psychology.
Slot machines run on it. So does a feed that sometimes contains something worth seeing.
Year
What was added
Effect on the behaviour
2006
Infinite scroll, patented by a Microsoft search team in February and
widely credited in public debate to Aza Raskin, who has since said he regrets it
Removes the page boundary, and with it the natural moment to stop
2006
The algorithmic news feed
Content is ordered by predicted
engagement rather than by time
2007
The iPhone
The feed is now in a pocket, available in every gap
in the day
2008
App stores and third party apps
Competition for attention
becomes a market with measurable winners
2008
Pull to refresh, built by Loren Brichter for Tweetie
A
deliberate physical gesture that produces an unpredictable reward, the slot machine
handle
2009
Push notifications and the like button
The device initiates
contact, and social approval becomes a countable quantity
2016
Fully algorithmic short video feeds
No follow graph required,
the schedule tunes itself per person within minutes
2018
Screen Time and Digital Wellbeing ship
The platforms concede
the problem exists, and make the counter-measure optional
Read down that column and the pattern is plain. Each step either removed a stopping point
or made the reward less predictable. Nothing in the list required the user to be weak.
Contested credit
The invention of infinite scroll is disputed. A Microsoft patent was filed in February 2006;
Raskin's account is the one that reached the public, and his regret is genuine, but the
priority claim is not settled.
FIGURE 2. Each step in the table removed a stopping point. The gesture is the last part left to the user.
03
How many people meet the criteria
The best single estimate for young people comes from a 2019 systematic review and
meta-analysis in BMC Psychiatry. Sohn and colleagues pooled 41 studies covering 41,871
children and young adults and found a median prevalence of problematic smartphone use of
23.3 per cent, with an interquartile range of 14.0 to 31.2 per cent. Roughly one in four.
The spread between countries is larger than the spread between people. Olson and
colleagues pooled 83 samples from 24 countries, 33,831 participants surveyed between 2014
and 2020, and found that country level factors accounted for 74 per cent of the variation in
scores. China and Saudi Arabia scored highest, followed by Malaysia, Brazil, South Korea,
Iran, Canada and Turkey. Germany and France scored lowest. Scores also rose year on year
across most countries over the period studied.
FIGURE 3. Median prevalence of problematic smartphone use among children and young people, 41 studies, 41,871 participants. Interquartile range 14.0 to 31.2 per cent. Sohn et al., 2019.
For context on the denominator, DataReportal put the number of unique mobile phone users
at 5.83 billion in April 2026, with 6.12 billion people online and 5.79 billion active on
social platforms. A quarter of the young users of a technology at that scale is not a niche
clinical population.
Read the interval, not the headline
A median of 23.3 per cent with an interquartile range of 14 to 31 means the studies disagree
substantially. Different scales, different cut-offs, different countries. The direction is
consistent, the precision is not.
FIGURE 4. Prevalence estimates describe ordinary settings and ordinary people, not a clinical minority.
04
What it is associated with
The same meta-analysis reported the associations below. These are odds ratios from
cross-sectional data, so they establish that problematic use travels with these outcomes,
not that it causes them. The confidence intervals are shown because three of the four are
wide.
FIGURE 5. Odds ratios with 95 per cent confidence intervals for outcomes associated with problematic smartphone use. Dashed line marks an odds ratio of 1, meaning no association. Sohn et al., 2019.
Attention is affected even when the phone is not used. Ward and colleagues, working with
nearly 800 participants, found that the mere presence of a person's own smartphone reduced
available cognitive capacity on tests requiring full concentration. Phones in another room
produced the best performance, phones face down on the desk the worst. Whether the phone was
switched on or off made no measurable difference.
The interruption cost compounds it. In observational studies of office work, Mark and
colleagues found that after an interruption people took roughly 23 minutes to return to the
original task. That figure was measured for workplace interruptions in general, not for
phones specifically, but the phone is now the most frequent source.
The volume is documented. Common Sense Media instrumented the phones of about 200
11 to 17 year olds for a week in 2023. Half of them received 237 or more notifications a
day, some received thousands, and 23 per cent of those alerts arrived during school hours.
Median pickups exceeded 100 a day.
Reported use has kept climbing. The global average sits near 4 hours 37 minutes a day on
the phone, with the United States near 5 hours 16 minutes, against 4 hours 45 minutes a day
of internet use across all devices and 2 hours 39 minutes on social and video apps.
FIGURE 6. Reported daily media time per user. Phone figures are self-reported averages; internet and social figures are DataReportal weekly means divided by seven, April 2026.
Direction of causation
Poor sleep and low mood both increase phone use, and phone use worsens both. The honest
reading is a loop, not an arrow. That is also why interventions aimed only at the phone
rarely fix the mood, and why interventions aimed only at the mood rarely fix the phone.
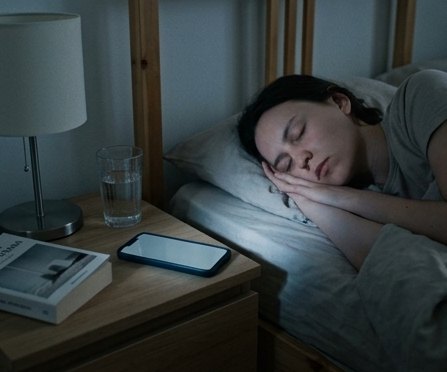
FIGURE 7. Poor sleep quality carried the widest confidence interval of the four outcomes, and the loop runs in both directions.
05
The strongest case against the panic
Any honest page on this subject has to include the counter-evidence, and it is
substantial. Orben and Przybylski analysed three large datasets covering more than 17,000
adolescents in the United Kingdom, the United States and Ireland, and found that technology
use explained at most 0.4 per cent of the variation in adolescent wellbeing. In the same
analysis, wearing glasses had a more negative association with wellbeing than screen time
did.
FIGURE 8. Share of the variation in adolescent wellbeing explained by technology use across three datasets and more than 17,000 adolescents. Orben and Przybylski, 2019.
Their target, though, is the quantity measure. Total hours is a crude variable that lumps
a video call with a grandparent together with three hours of passive scrolling, and it
predicts almost nothing. The prevalence and outcome studies further up this page use
compulsion scales rather than hours, which is why they find larger effects. Both results can
be true at once: time on a screen is a weak predictor, loss of control over that time is a
strong one.
The practical implication is not that the problem is imaginary. It is that a person who
wants to change something should stop measuring hours and start measuring pickups they did
not decide to make.
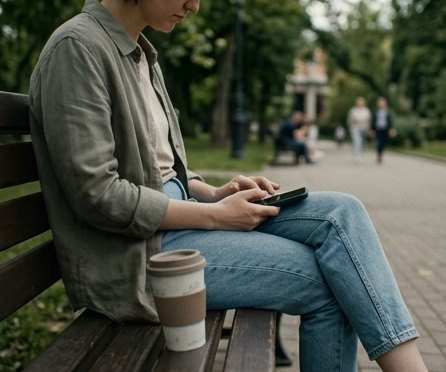
FIGURE 9. Ordinary use, and most of it is fine. The disputed question is where ordinary ends.
What would settle it
Randomised trials with objective use data, measured over months rather than days, reporting
pre-registered outcomes. There are few of them, they are expensive, and the platforms hold
the data that would make them cheap.
06
Why it happens at the reach and not at the intention
Put the findings in order and a single mechanism accounts for most of them. The pickup is
cued by a gap rather than by a decision: the queue, the ad break, the pause between two
tasks, the ten minutes in bed. The reward is unpredictable, which is the schedule that
sustains behaviour longest. The stopping point has been engineered out. The device also
initiates contact hundreds of times a day, so the gap does not even have to be found.
Every part of that runs below deliberation, which is why advice pitched at deliberation
keeps failing. Resolutions, screen time dashboards and app deletion all assume a moment of
choice that the behaviour does not contain. Deleting one app reliably moves the reflex to
the nearest substitute, because the reflex was never about the app.
What is left is the reach itself. An intervention has to sit there, it has to impose a
cost at the moment the hand moves, and the cost has to be one the person cannot waive for
free, or it stops mattering within days.
Most blockers take the opposite route and try to make the block impossible to remove,
which is why they end up deleted. If you are weighing up the paid apps in this category,
the Opal Alternative page sets the two approaches side by
side, with prices.
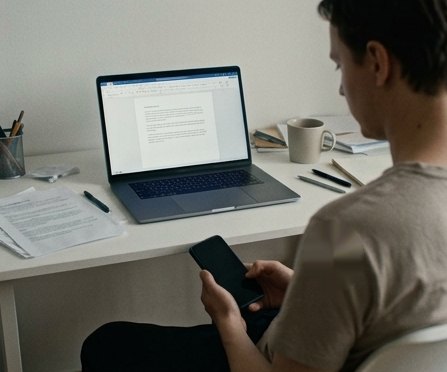
FIGURE 10. The mere presence of the phone lowered measured cognitive capacity even when it was switched off.
Where this leads
This is the reasoning behind Handover. Rules are narrow, the way back in is always open, and
the way back in costs something you would rather keep.
07
Sources
Sohn S, Rees P, Wildridge B, Kalk NJ, Carter B. Prevalence of problematic smartphone
usage and associated mental health outcomes amongst children and young people: a
systematic review, meta-analysis and GRADE of the evidence. BMC Psychiatry, 2019;19:356.
Olson JA, Sandra DA, Colucci ES, Al Bikaii A, Chmoulevitch D, Nahas J, Raz A,
Veissiere SPL. Smartphone addiction is increasing across the world: a meta-analysis of 24
countries. Computers in Human Behavior, 2022;129:107138.
Kwon M, Kim DJ, Cho H, Yang S. The Smartphone Addiction Scale: development and
validation of a short version for adolescents. PLoS ONE, 2013;8(12):e83558.
Ward AF, Duke K, Gneezy A, Bos MW. Brain drain: the mere presence of one's own
smartphone reduces available cognitive capacity. Journal of the Association for Consumer
Research, 2017;2(2):140 to 154.
Mark G, Gonzalez VM, Harris J. No task left behind? Examining the nature of fragmented
work. Proceedings of CHI, 2005.
Radesky J, Weeks HM, Schaller A, Robb M, Mann S, Lenhart A. Constant companion: a week
in the life of a young person's smartphone use. Common Sense Media, 2023.
Orben A, Przybylski AK. The association between adolescent well-being and digital
technology use. Nature Human Behaviour, 2019;3:173 to 182.
Kemp S. Digital 2026 global overview, April 2026 update. DataReportal.
World Health Organization. Inclusion of gaming disorder in ICD-11, 2018.
How to read this page
Every figure above is traceable to one of these nine sources. Where a number is an estimate
with a wide interval, the interval is printed rather than hidden.